Stock Ledger Report
Use the Stock Ledger Report to track the historical movement of your inventory items within a given period! This report gives you a useful breakdown of which inventory items have been received, picked for jobs, sourced, and more.
Please note, this is different from the Stock (On Hand) Report (previously called Stock Report), which simply shows you the total value and quantity of stock currently in your inventory.
IMPORTANT: As the Inventory Ledger feature was introduced on 7 October 2025, you will not be able to see entries before this date.
In this article:
Understanding Your Stock Ledger Summary
Viewing Your Ledger Entries in Detail
Overview of the Stock Ledger
To access the stock ledger report, navigate to Reports and click Stock Ledger:

Please Note: When reporting on large periods of time, the report may take longer to generate. We recommend limited your filtered date range to improve this experience.
Your stock ledger will look something like this:

You will see the options to Filter, Export and Print at the top of the report.
Below is the date range for the report; this will automatically be set to This week.
Please Note: The stock ledger report cannot track data from before 7 October 2025. If you set the period filter to an earlier interval, e.g. Last quarter, your report will show up blank:

You can filter the report by inventory item SKU, Location, Category, Supplier, or Brand.
You can also use the Assignment filter to look for items Assigned to jobs or Not assigned to jobs (i.e. available stock):

Or you can filter for items assigned to a specific job(s):

You can also show/hide the following columns in your stock ledger: Date, Staff, Reason, Value, Value Change, Units, Units Change, Quantity, Quantity Change, Price per Unit, Price per Unit Change, Units per Item, Units per Item Change, Job, Inventory Item, Category, SKU, Location, Supplier, Barcode, Brand, Range, Finish, Colour, Size. Learn more about showing/hiding columns
As with other reports, you can create a Custom Report once you have found a combination of filters and columns that suits your business:

Understanding Your Stock Ledger Summary
Your stock ledger summary will look something like this:

- Total Value: The total value (i.e. cost) of all stock/inventory at the end of the specified period.
- Total Value Change: The increase or decrease in your Total Value since the beginning of the specified period.
Your Total Value Change is further broken down into the following subtotals:
- Received: The total cost of all stock received into inventory during the specified period. This should always be a positive value.
- Picked: The total cost of all stock picked for jobs during the specified period. This should always be a negative value.
-
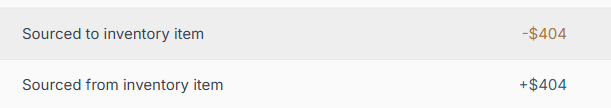
Sourced: The total cost of all stock sourced to inventory. This will usually have a value of $0, because when a material is sourced to inventory, a positive entry is created (for the inventory item assigned to the job), and a negative entry is created (against the total items in stock):
- Adjustment: This accounts for any manual changes made to inventory items by staff, e.g. changes in quantity or value.
- Deleted/Restored: This accounts for any inventory entries deleted or restored by staff.
- Unknown: This accounts for any other changes in value not covered by the above. This will usually show $0.

Please email help@jobman.com if you see any irregularities in your stock ledger summary that you cannot account for.
Viewing Your Ledger Entries in Detail
Below the stock ledger summary, you will see that your ledger entries are arranged in into group headers and footers. The group header will state the inventory location, the material name, and a bracketed number, e.g. (1), (2), (3), etc. The group footer will state, Latest: [day/month/year].
Example:

In the above example, the number (4) in the header means there are four entries for the material "AMBIA-LINE bottle divider height 45 mm [4478837] for location "Warehouse B." The footer states that the latest entry was made on 6/10/2025.
For inventory entries to be placed in the same group, they must have the same location, material name, SKU, supplier, and category.
You can expand any group to view all its entries by scrolling to the far right of your screen and clicking the down arrow for that group header:

The group will then expand to look something like this:

The exact information you will see depends on which columns you have enabled (see previous section). However, generally you will see the entry date, the staff member who performed the action, the reason for the entry, and the value, value change, units, units change, quantity, quantity change, etc.
Please Note:
- The entries are shown in chronological order, i.e. the latest entry will be at the bottom.
- The group footer will show the current totals for each column for that material. However, these will not necessarily be arithmetical additions of the group entries above.
In the example shown above, the Value column shows $404, $0, $404, and $0 for each of the entries, then a total of $0:

This is because the first entry shows that items were received totalling $404 in value.
The second entry shows $404 worth of material was sourced to a job from inventory, lowering the total value back to $0.
The third entry shows $404 worth of material was added to inventory assigned to a job, bringing the total value back to $404.
The fourth entry shows $404 worth of material was removed (picked) from inventory for a job, bringing the total value back to $0.
This is why the total in the group footer shows $0, not $808. This is shown more clearly in the Value Change column:

The same goes for the Units column, Units Change column, and so on.